
HOW TO USE AZURE DEVOPS
Nghia Song - Microsoft Dynamics 365 Technical Consultant
Nghia Song
Tel - WhatsApp: +84967324794
Email: songnghia.uit@gmail.com
Source: Votiva - TC
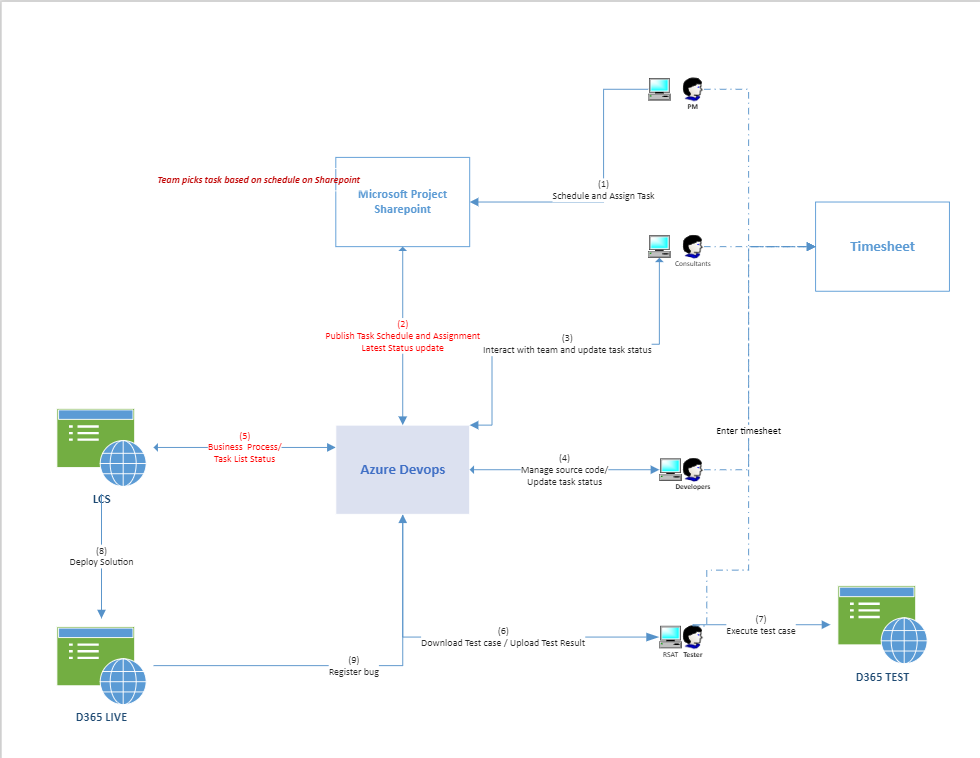
Why do we use this tool?
Assist in following, tracking, and archiving all discussions on our tasks and bugs.
Easier to locate existing issues, as well as all discussion and solutions for them -> save time finding the correct person to check, finding a testing/checking environment, and so on.
Keep track of all project work items, including how many are completed, pending, and issues.
TC to manage code, tun builds, deploy
Notifications: Members of your organization can be notified or opted out of notifications for nearly any action in Azure DevOps. The major reasons for notifications are work assignment and build success/failure. Often, stakeholders want to be notified when a new build has been deployed. This is possible even when the stakeholders don’t have full access to the project. Notifications can be overwhelming if there’s a lot of activity in a project, so it’s best to keep them appropriately scoped.
Who can use this tool?
TC: get tasks assign, update status, consult with FC/PM, and review source code
FC: create a task, create a bug, test and talk to TC about it.
PM: create task, create bug, discuss with TC/FC, track task, bug, and have a project summary
CS: write a ticket and save it as a library to find the same bug or issue later.
How to access:
From https://dev.azure.com/project where you can see all projects as well as all features of the azure devops
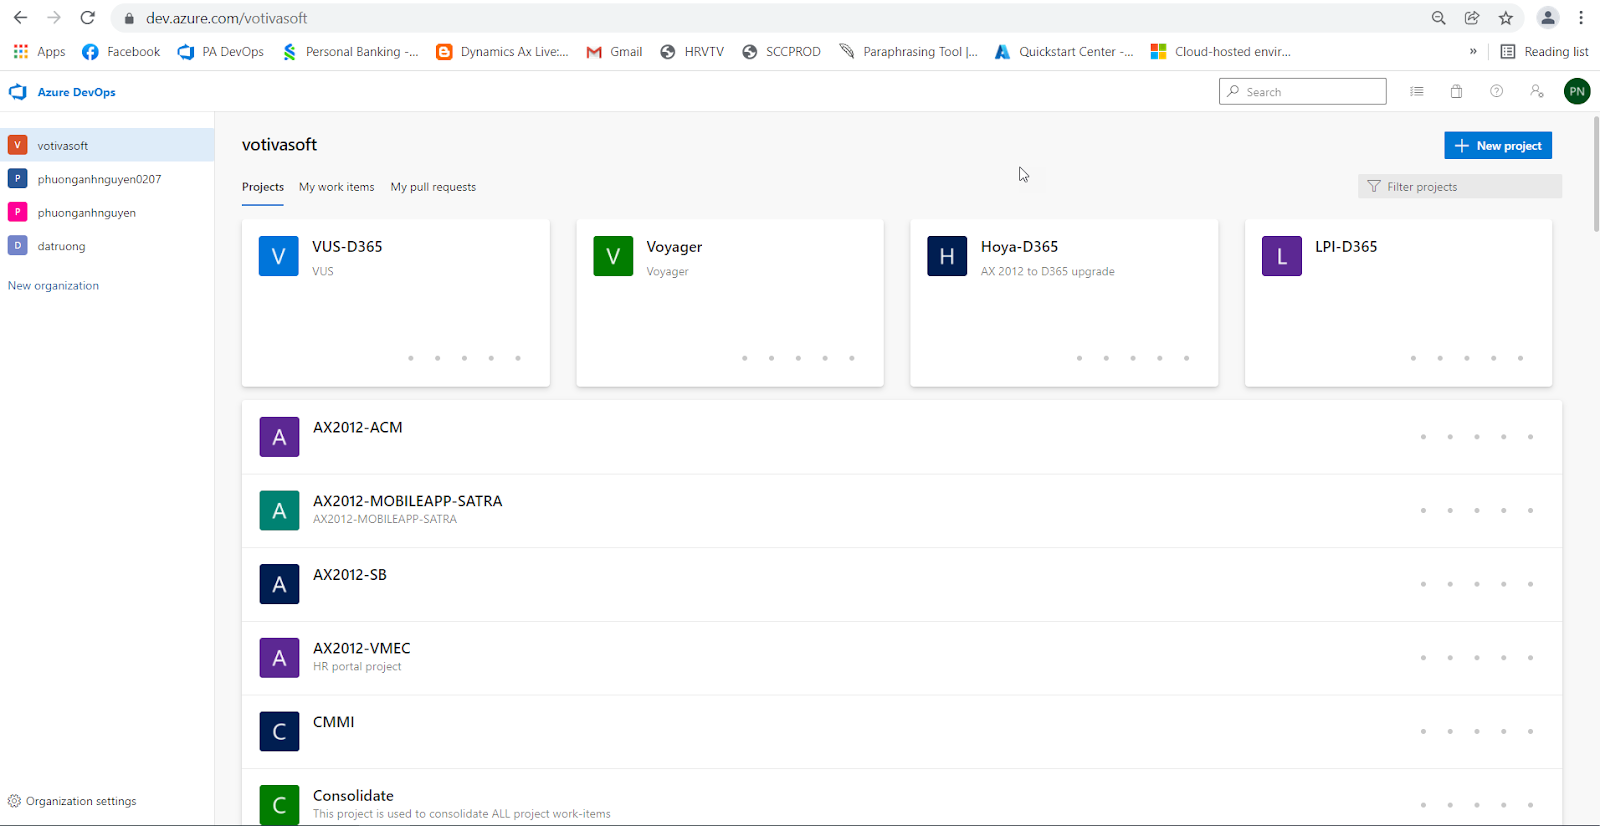
From MS team - specific channel where you can access directly to a specific project

After select project Form Azure devops you can view your Dashboards - Dashboard could be built by yourself
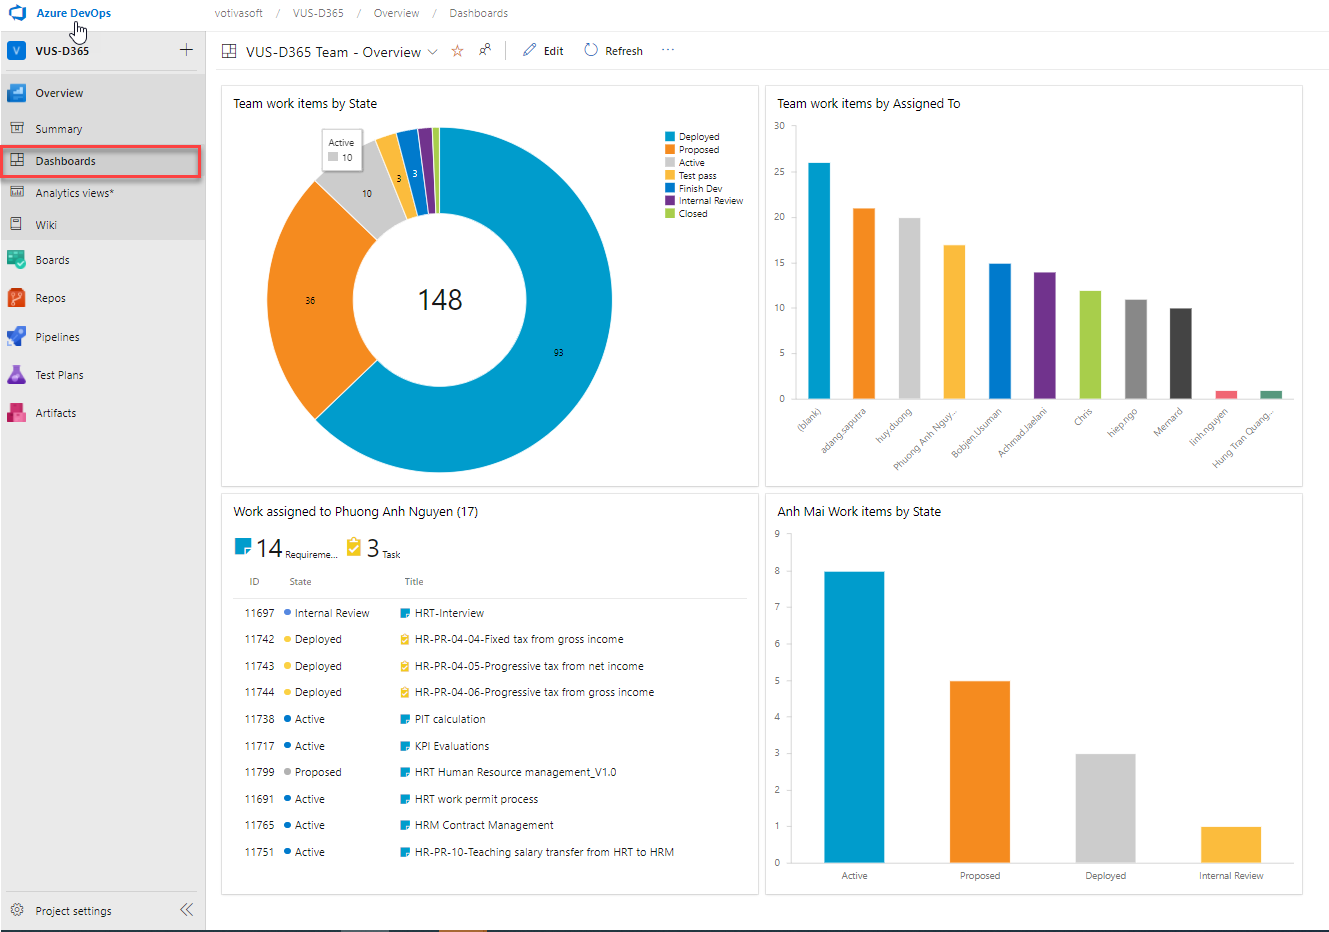
Click Edit to modify your dashboard. To add a Widget to dashboard you need to build a shared query
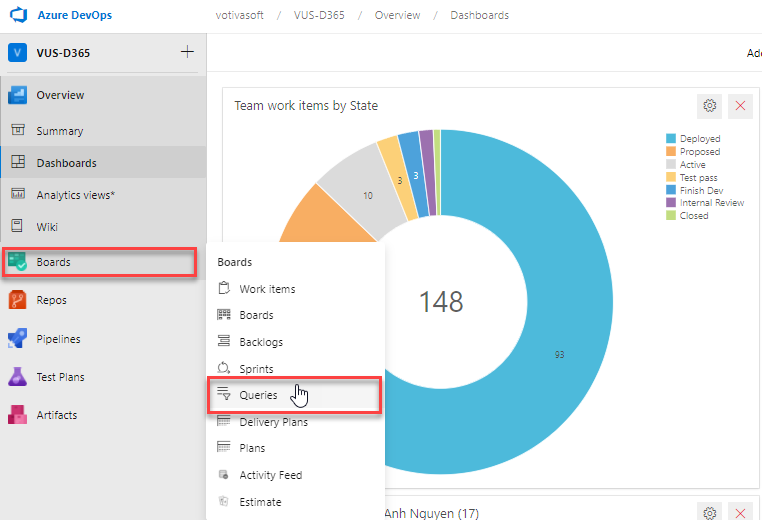
Then click on New Query
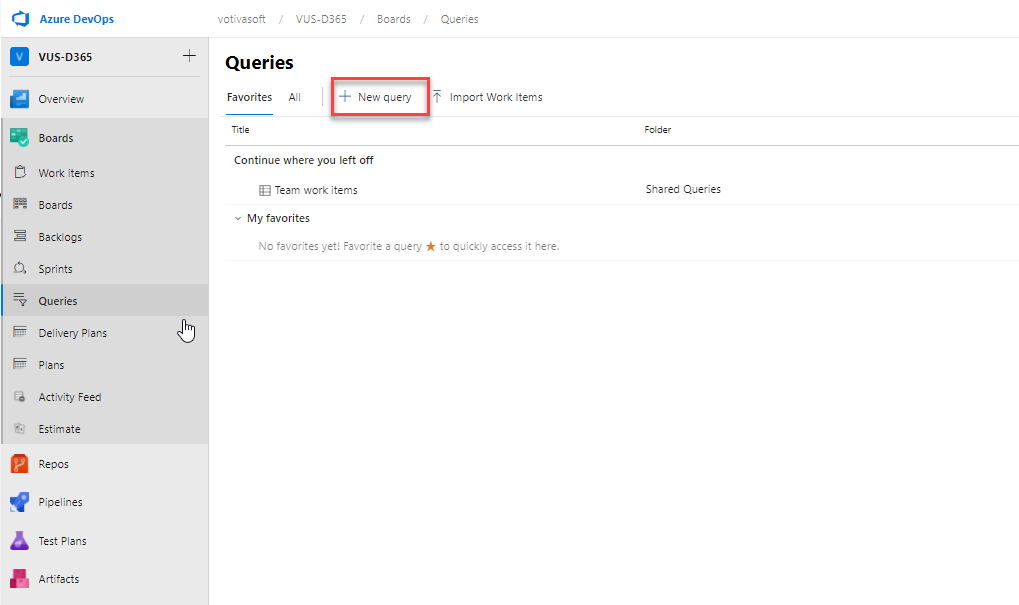
You can build your query based on which data you want to display on dashboard
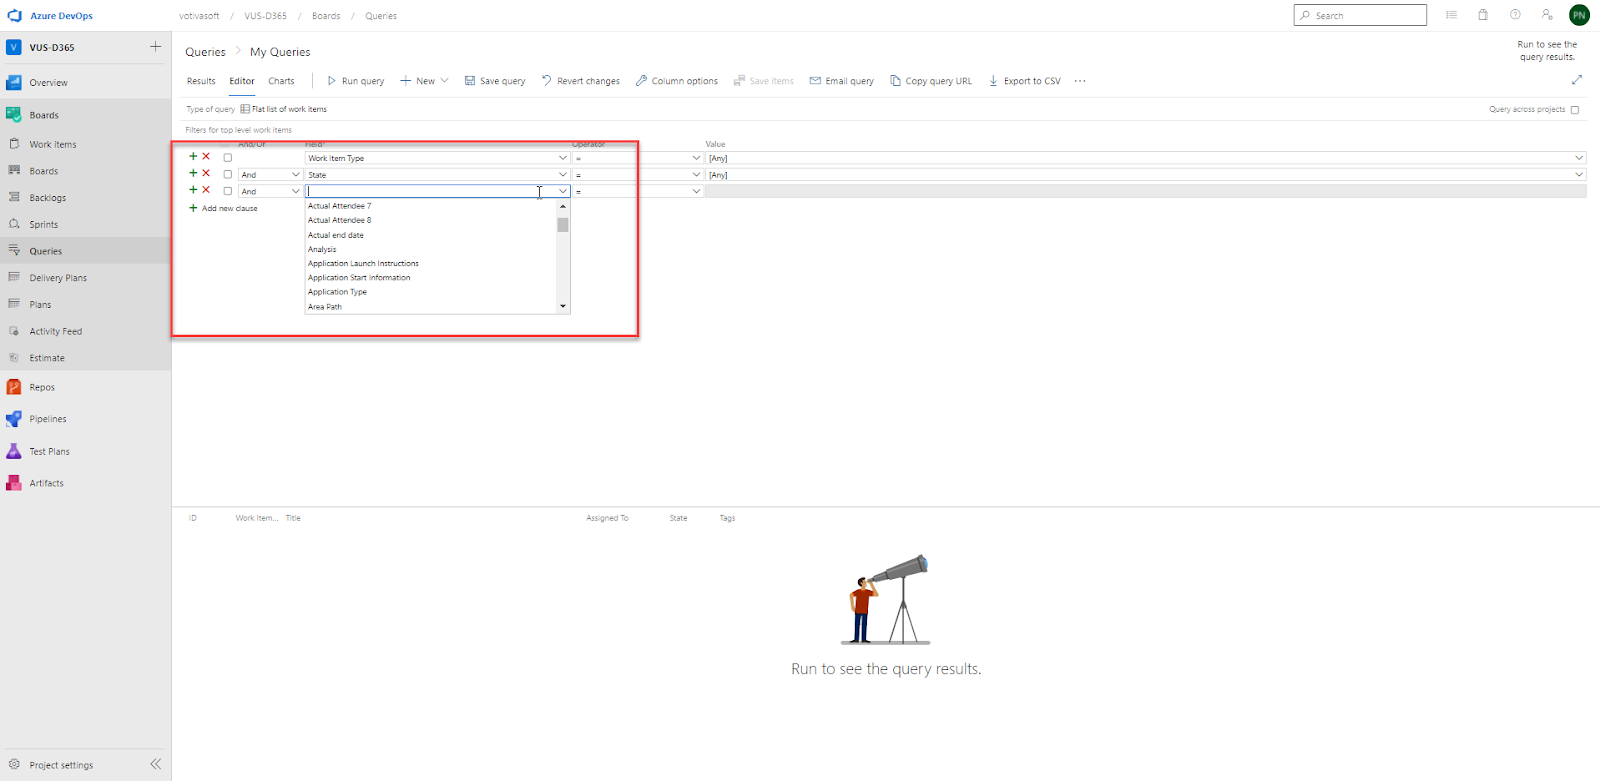
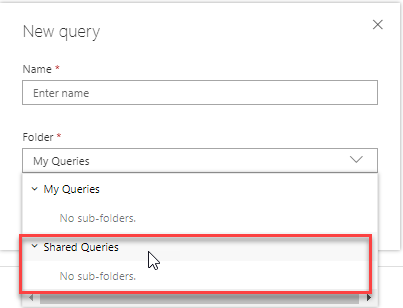
Then save your query to shared queries folder
From Dashboard -> select query for your widget and config
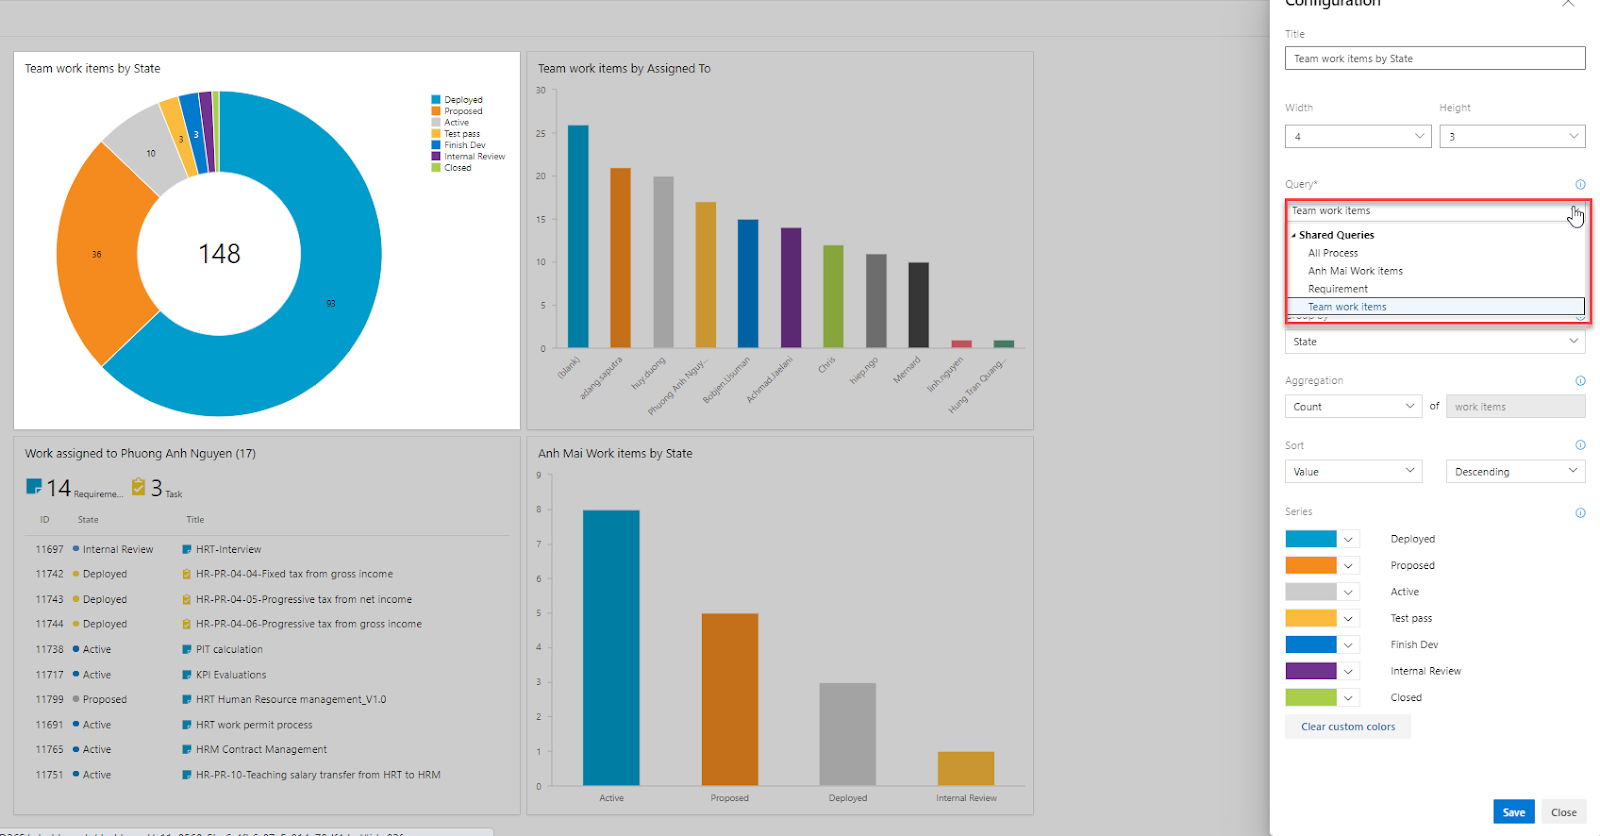
Save and click Done Editing when you finish.
From Azure Devops you have many of menu such as:
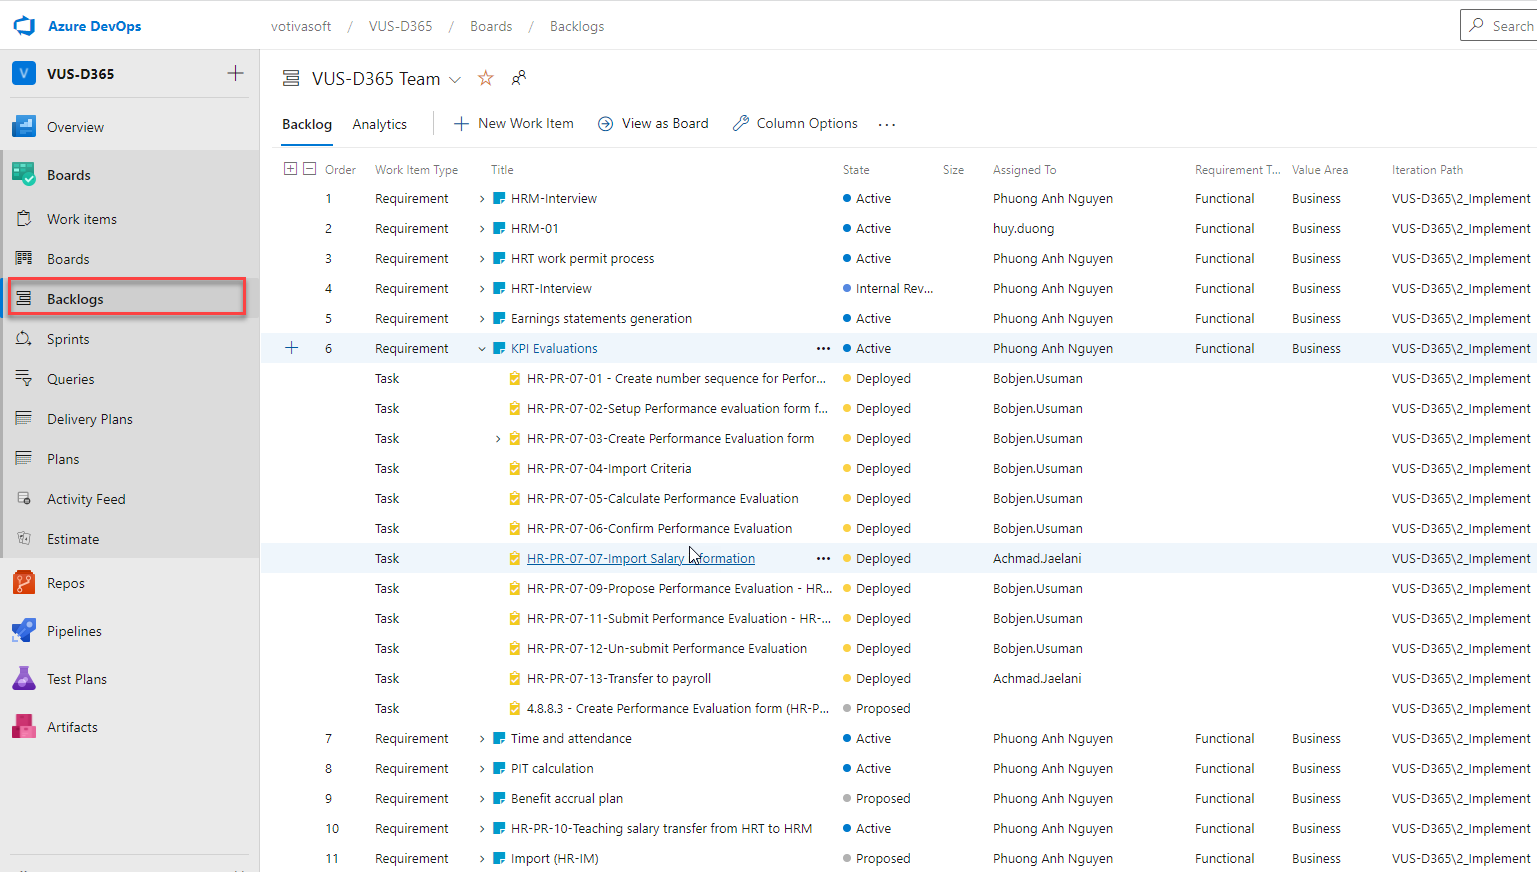
Backlogs: where to create Requirements -> we can create this based on the FDD document. We can say that we have a request from our client, and from that request we have many of GAPs -> bring to Azure Devops we have Requirement and tasks. In this picture below we have a request to Evaluate the KPI for employee. In the FDD we define numerous GAPs to meet that request such as Create KPI form, Create number sequence for KPI number etc.
We can also create work item from work items menu -> list of all tasks/bugs etc. of project. You can filter data from this page
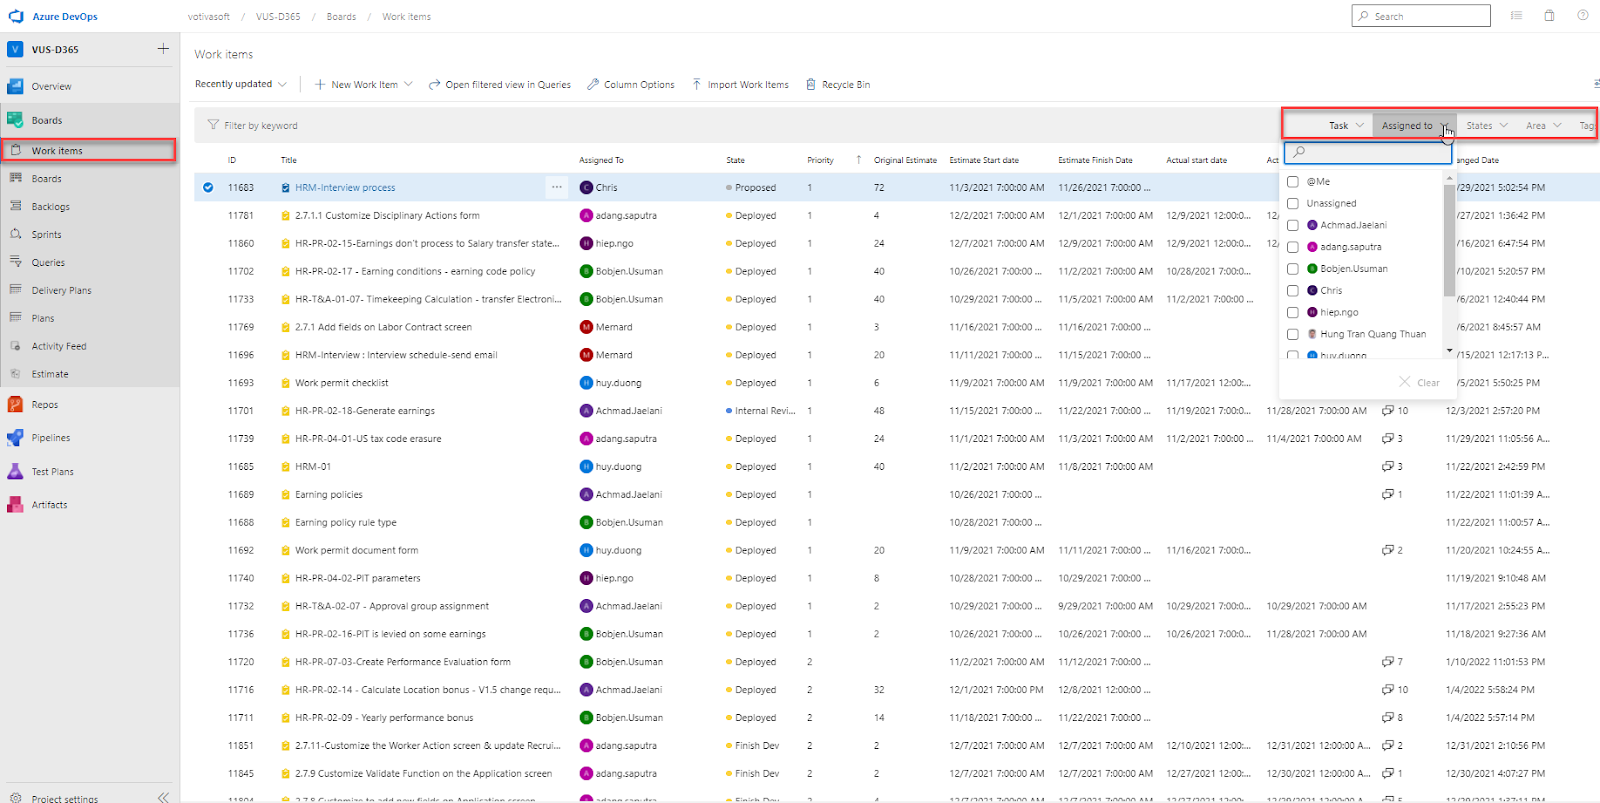
You also can personalize this list page by add/remove column

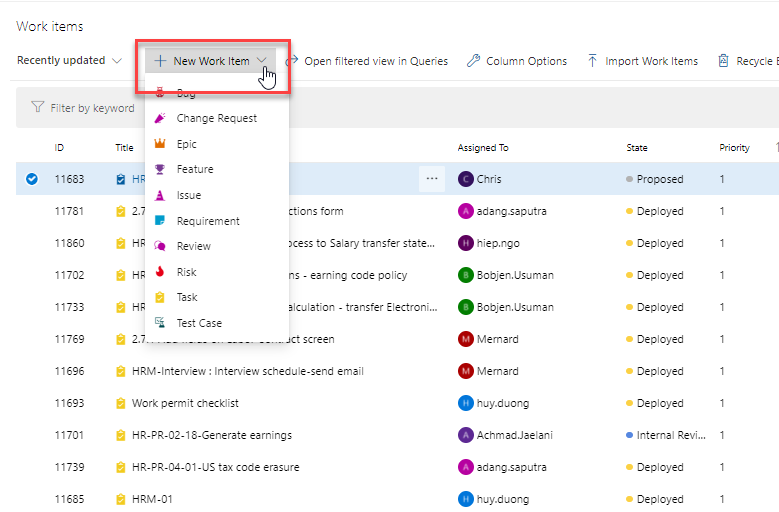
How to create new work item:
Click new Work Item then select work item type that you want to create
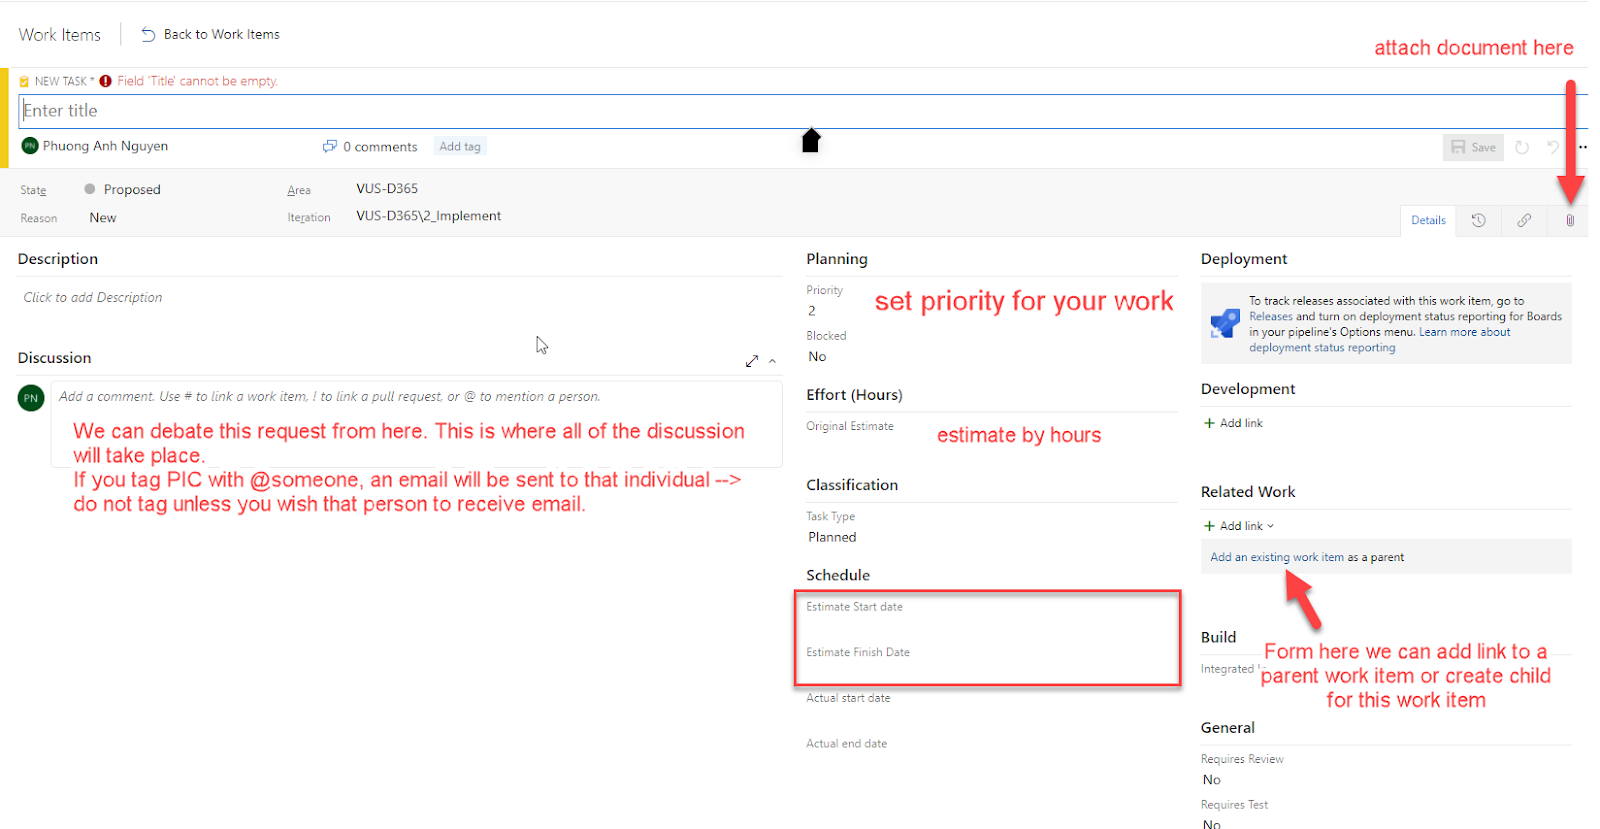
Work Item page is open, and you need to full fill all needed data:
Person in charge
Area: You can use areas to split work up logically, match it to functional areas, or even create areas for various lines of business, such as financial, risk management, human resources, etc. Within a larger project, areas really come in handy to make the work and boards more manageable.
Description
Priority
Original Estimate: estimate time by hours
Estimate Start time
Estimate End time
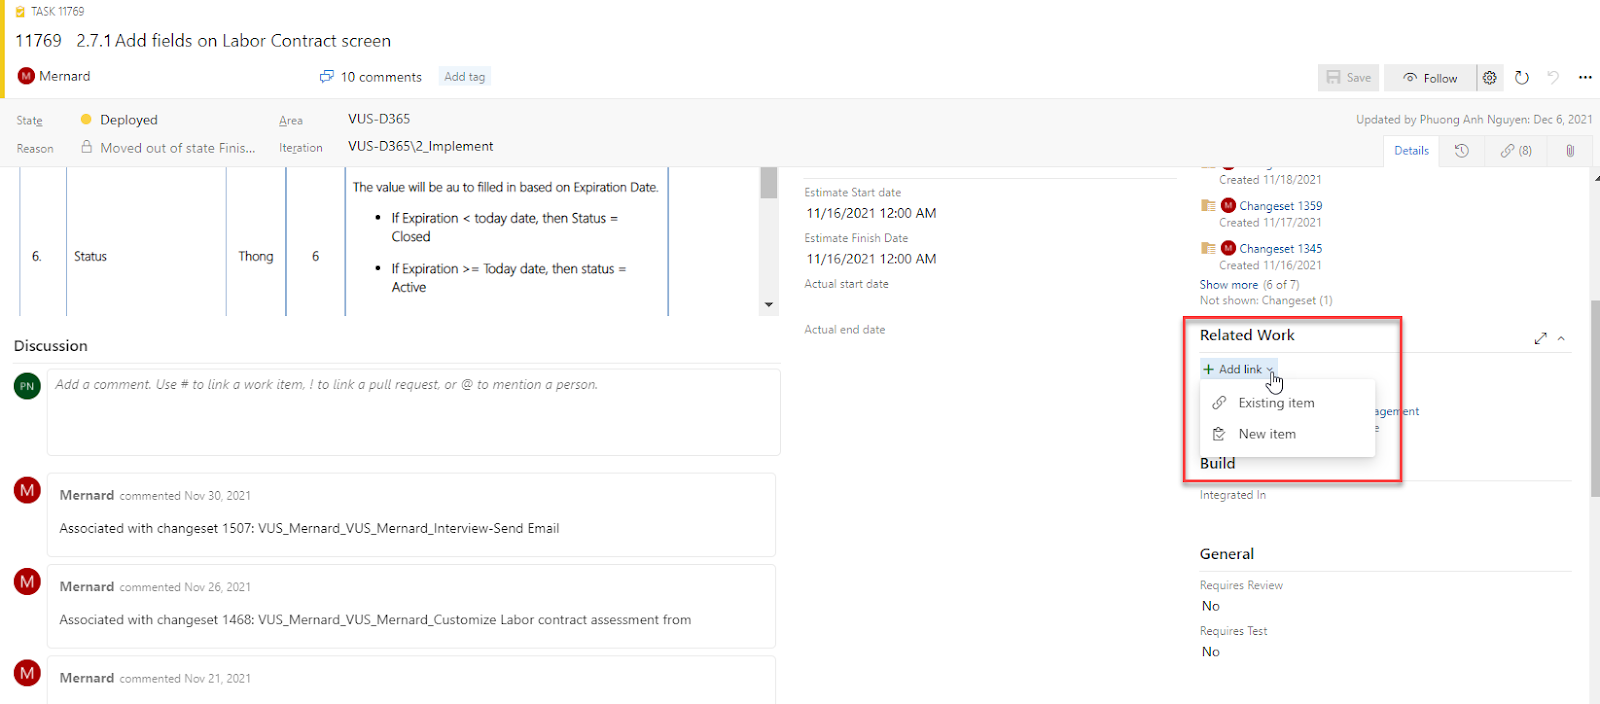
You can also add child or parent for this work item by Add link from Related work session as below
To add Child / parent work item to a work item
When you start working on this work item: -> update:
Actual start date.
Change State to Active
When you finish -> update:
Actual end date.
In Discussion tag @PIC to notify them.
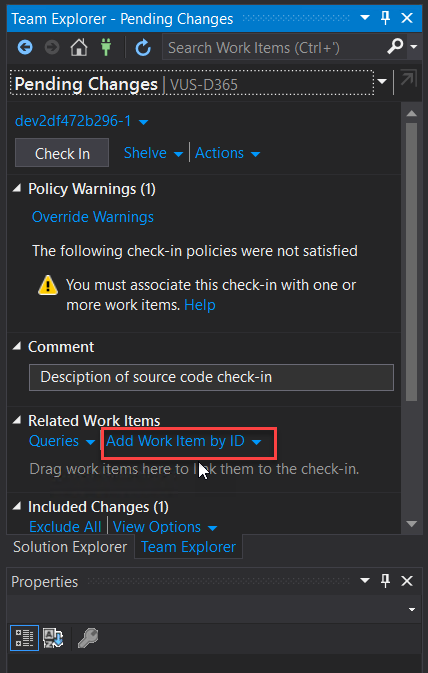
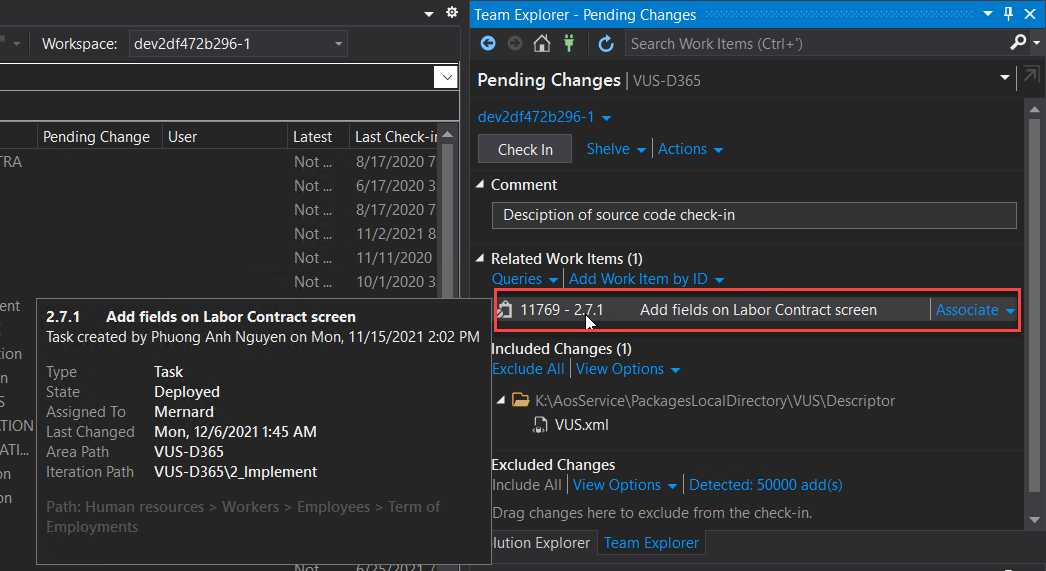
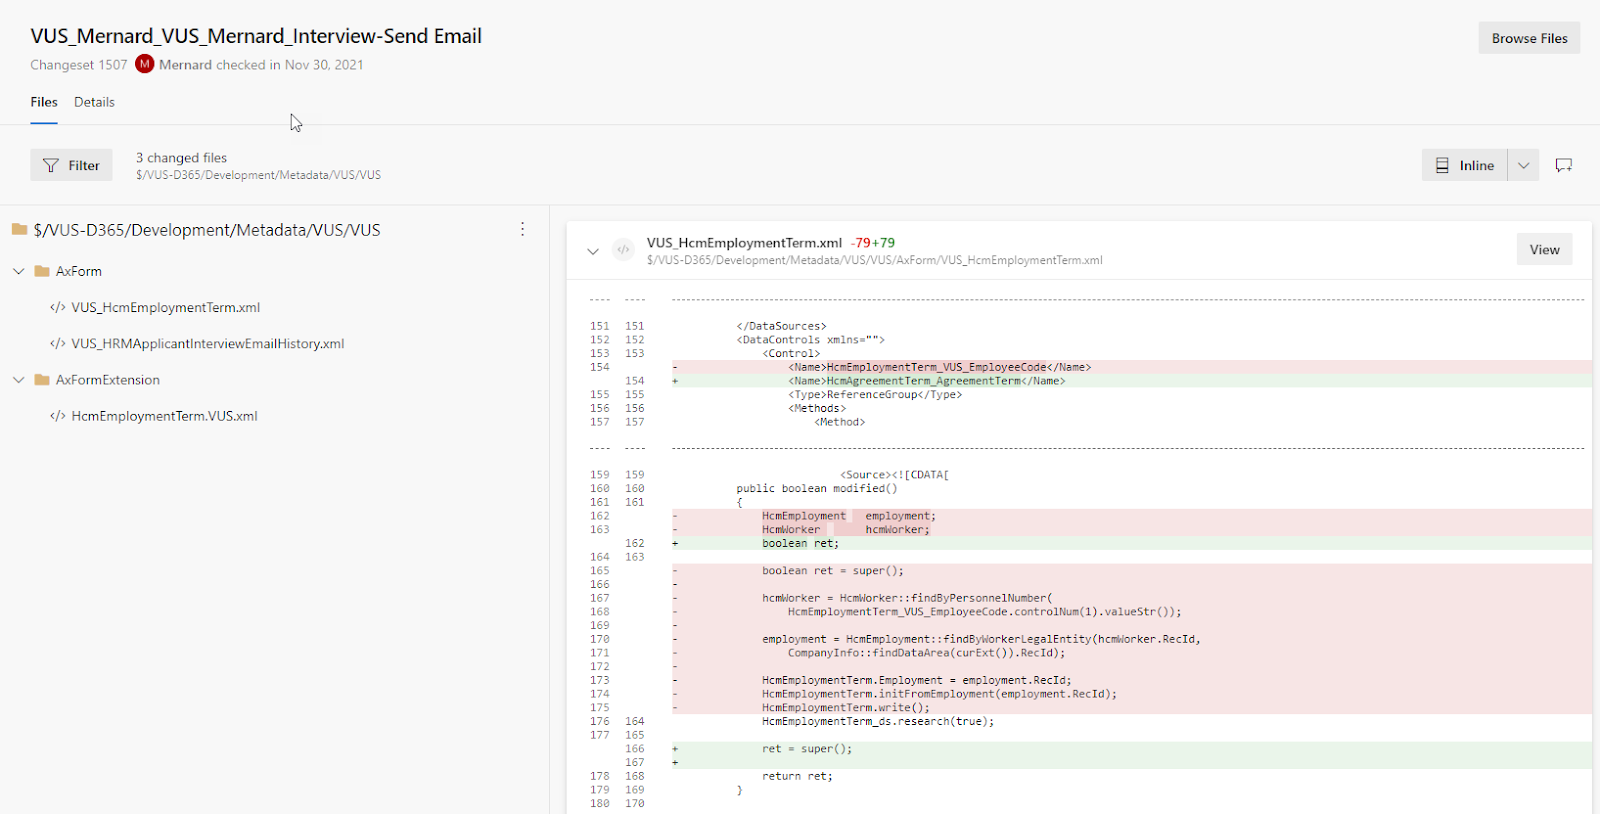
For TC – when check – in source code from visual studio -> add work item ID from Azure devops to link changeset vs. work item
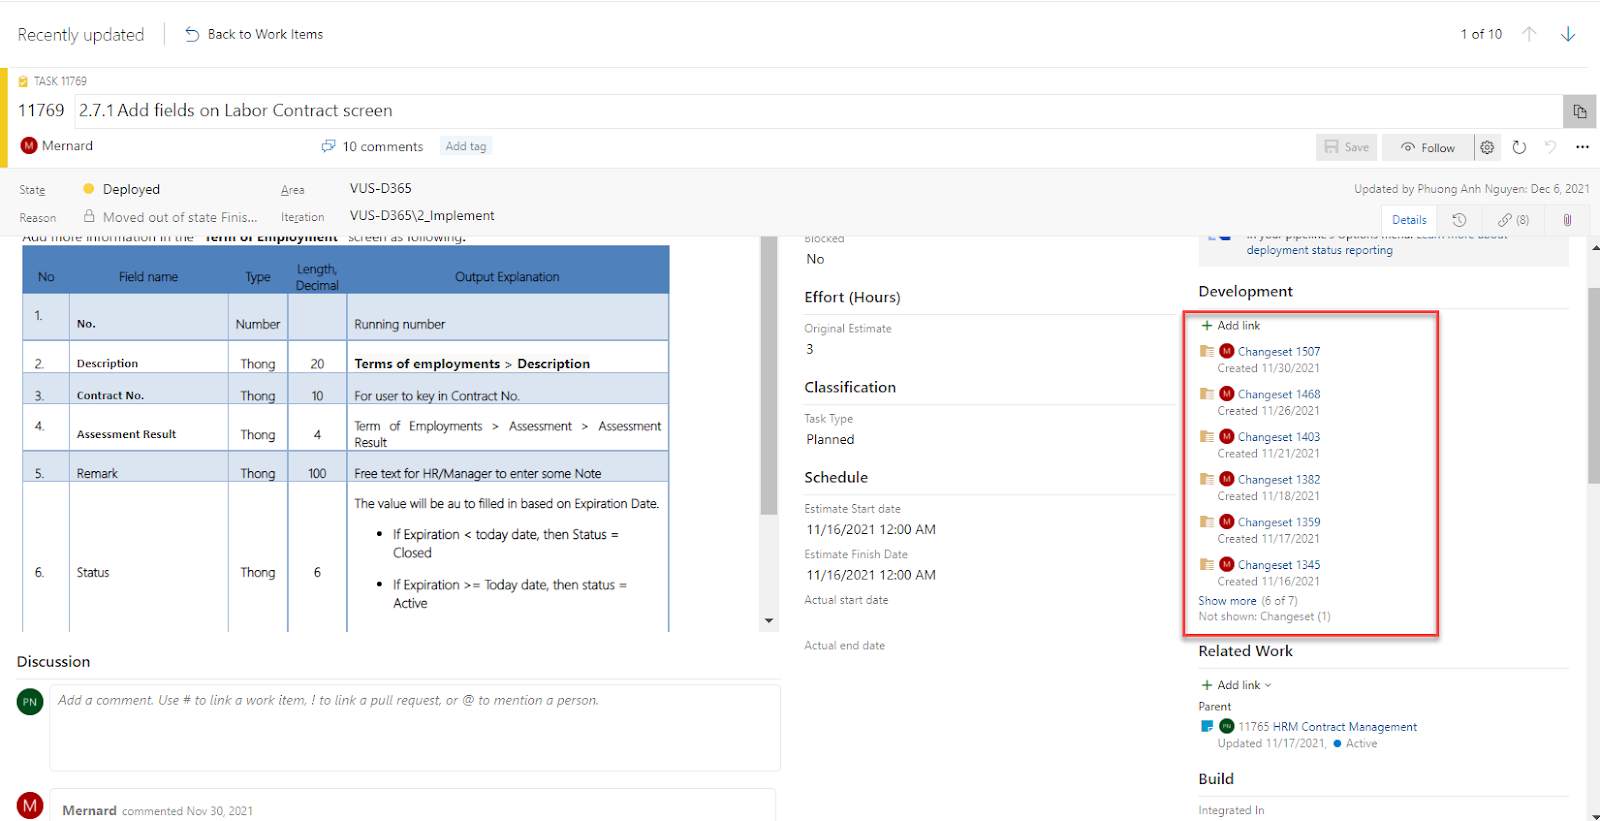
-> from Azure devops work item we can check changes code without access to development environment. TC can check which code changed form a changeset by click on that changeset
Next implement plan:
For TC: Pipelines -> auto build package after code check-in: how to apply and which phase?
For PM: how to map with project management
Analytics: Azure DevOps has several types of built-in analytics reports. It has control charts, cumulative flow diagrams, and burn charts to help understand workflow patterns. There are charts for pipelines and build health. And it has charts for testing concerns. Charts can be added to dashboards or viewed individually from the related Azure Boards feature.
Wiki: There is a wiki that can be used for notes, requirements, and documentation. Often, this is where information stagnates, but wikis can really be helpful if there is a practice of participation and shared ownership. Teams may face challenges organizing wikis and often end up with outdated or repeated information. However, a well-maintained wiki can serve as a useful information resource, especially for historical context ?
…

 WhatsApp


0 Comments